Revisiting the Trinity Study: 4% Not What It Used To Be
If you’ve hung around personal-finance forums for any length of time (and god help me I have), you’ve run across the “4% rule”: when you’re figuring out how much you can spend in retirement, the rule of thumb is that you can withdraw 4% of that initial lump, per year, inflation-adjusted, with a very low risk of running out of money at any time in the ensuing thirty years. (You might also have seen this stated as the “rule of 25”: if you have a retirement lump of cash equal to 25x your annual spending, you’re good to retire.)
The 4% rule has become conventional wisdom in personal finance circles; the problem is, it isn’t true any more. It was true when it was postulated, but thanks to longer life expectancies the benchmark for “do I have enough to retire” needs to be more conservative; 3.5% is a better benchmark for today’s retirees.
The rule was originally set forth in 19981, in a paper by three professors at Trinity University in San Antonio. They sourced the returns for the S&P 500 and investment-grade corporate bonds, as far back as 1926; then, they calculated the returns for investors in various mixes of stocks and bonds, over horizons as far out as thirty years, and asked “for different withdrawal rates (as a percentage of the portfolio), what’s the likelihood of making it to thirty years without running out of money?”. They called this the success percentage.
They found that, for any thirty-year period starting between 1946 and 1965 (their data ended in 1995), any investor who bought any mix of stocks and/or bonds, and withdrew 4% per year, would never run out of money. Even stretching the time horizon back to 1926, to capture the crash of ‘29, the Great Depression, and World War II, investors would only have run out of money in 1-2% of scenarios.
As they put it:
if history is any guide for the future, then withdrawal rates of 3% and 4% are extremely unlikely to exhaust any portfolio of stocks and bonds during any of the payout periods shown in Table 1. In those cases, portfolio success seems close to being assured.
And so a meme was born.
To the Trinity professors’ credit, further down in their paper, they run the numbers for inflation-adjusted withdrawals as well2, noting:
the dramatic decline in many of the portfolio success rates, especially for mid-level and high withdrawal rates. Despite the adjustment, however, withdrawal rates of 3% to 4% continue to produce high portfolio success rates for stock-dominated portfolios.
Still, the 98% portfolio success rate for a 75⁄25 stocks/bonds portfolio was good enough for most people to run with a 4% withdrawal rate, inflation-adjusted.
That was February 1998. Since the study was run, life expectancy in the USA has increased by three years, from 76.5 to 79.53, so people’s retirement savings have to stretch for longer. Bond yields have dropped since February 1998, so bond-heavy portfolios might deliver lower returns in future. And inflation, while it’s much less volatile than it was over the period of the Trinity study, is running notably above target and is reluctant to get back to where it needs to be.
People are living longer, markets are different, and that might necessitate restating the Trinity rule. To that end, I re-ran the Trinity study’s “inflation-adjusted” arm, with a few methodological tweaks to update it for the 21st century.
I ran the study for a forty-year window as well as a thirty-year window, to reflect longer life expectancies. I used a different window of source data: 2002 to 2025, because the Trinity study has come in for some criticism for using source data from as far back as the 1920s. I used SPY total-return data instead of the S&P 5004, and LQD total-return data for the bond leg.
And rather than using sliding windows over market data like the Trinity folks did, because that means my real number of observations would be much lower than the stated number, I Monte-Carloed it. I sampled individual months’ returns from the pool of source data (e.g. using the SPY, LQD, and US CPI for September 2002) to create a synthetic 360- or 480-month return series, and then repeating the sampling process 1,000 times.
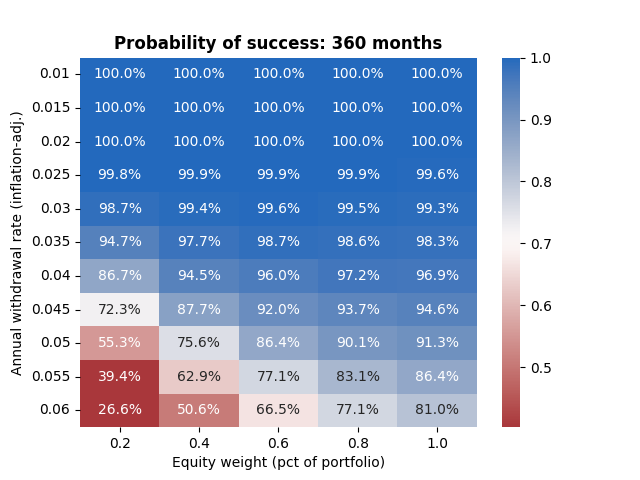
The first finding: over a thirty-year horizon, the 4% rule still holds. A 60⁄40 portfolio, with 4% inflation-adjusted withdrawals, still has a 96% probability of success, roughly in line with the original study (which found a 95% success probability for a 50⁄50 portfolio).
Secondly: success probabilities for higher withdrawal rates are slightly higher today than those estimated by the Trinity study. The improvement appears across both stock-heavy and bond-heavy portfolios, which makes me think it’s due to inflation being both lower and less volatile today than it was during the twentieth century.
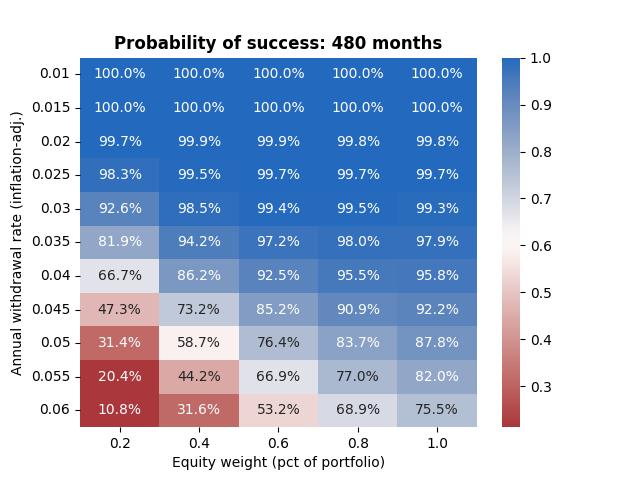
The third finding is the most challenging: the 4% rule does not hold over a forty-year horizon; getting the same level of safety requires a 3.5% withdrawal rate over the longer horizon. To put hard numbers on it: a 60⁄40 portfolio has a 96% chance of success over thirty years, but only a 92% chance of success over forty years; to reach a 96% chance of success over forty years, you need to reduce your withdrawal rate to 3.5%.
Intuitively, this makes sense. A longer horizon means more chance of running out of money: the survival probability can’t go up as the horizon gets longer. We can see this if we put the 360- and 480-month success probabilities next to each other: the success probability on a longer horizon is slightly lower for equity-heavy portfolios, and much lower for bond-heavy portfolios. It means that even though lower inflation has given portfolios a tailwind, those portfolios need to last for a much longer time, and therefore it makes sense to spend them down less aggressively.
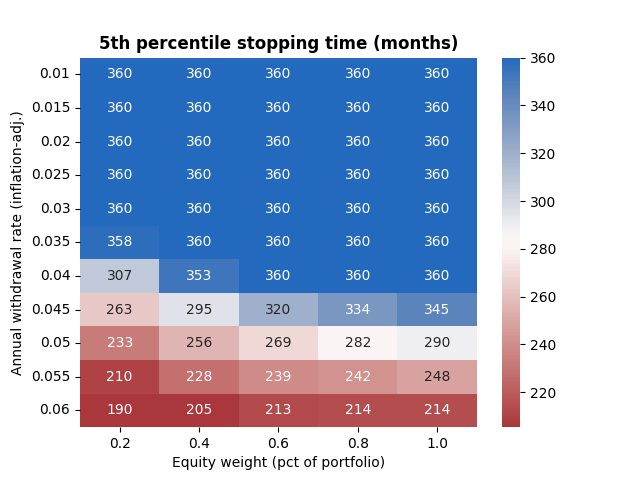
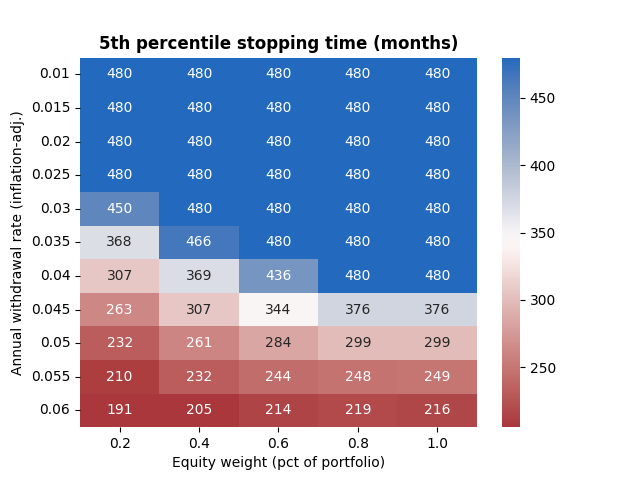
As a bonus, I generated the fifth-percentile stopping times—that is, “95% of the time, a portfolio with these parameters will last for at least this long”. The interesting finding here is that you can’t support a high withdrawal rate by rolling the dice on equities: at withdrawal rates of 5% or above, 100%-equities portfolios don’t last much longer than portfolios with 20% equities and 80% bonds.
The Trinity Study’s findings seem to have held up well over the years, as you’d hope for an academic paper so famous that it has its own Wikipedia page. Where it trips up is our increased longevity: we’re living longer, so all other things being equal, we need to be a touch more conservative when spending our retirement money. But kudos to the Trinity professors, not just for developing an interesting finding, but for having it turn into a handy rule that, for thirty years, has helped people feel a little bit better prepared for retirement.
- …when you could still get five-and-a-half percent on a 10-year Treasury, which affects the study’s conclusions a bit! [return]
- To their discredit, they follow that up with “Many economists believe, however, that inflation as measured by the CPI overstates the actual increase in cost of living by 1.0 to 1.5 percentage points per year. If so, then the portfolio success rates in Table 3 are biased downward,” and I’d invite you to ask anyone who’s bought eggs or beef or gasoline lately whether they agree that CPI overstates actual cost-of-living increases. Wear flameproof underpants. [return]
- It’s been even bigger in other countries: Australia’s life expectancy has increased from 78 to 84 years over the same period. [return]
- Infuriatingly, the original Trinity article doesn’t say whether they used SPX price-return or total-return data. The difference matters a lot over thirty years! [return]